
Many people talk about “Big Data” and analytics, yet few understand what it means. The term analytics basically refers to the application of math and statistics to data sets, and it is certainly not a new idea. However, certain aspects of it have changed over the past five years because of databases like Hadoop that make it possible to analyze unstructured data (i.e., data that is not organized into the familiar row and column format of a spreadsheet).
Microsoft Excel supports analytics with the Analysis ToolPak. It has been available for several versions of Excel. Here is now to use it with a simple example: a moving average.
The Analysis ToolPak add-in provides these analytic techniques and more:
A moving average is used to predict trends. It basically takes a subset of consecutive data points and makes an average out of it. Thus, the average “moves” along a line. That lets the analysis drop outliers or data points that would skew the trend. It also lets you make a seasonable prediction by using just the season (i.e., a subset of the whole year).
A solver uses linear programming to find an optimal solution for an array of linear equations subject to some constraint. The most common example use for this is the transportation problem, which figures out how to make deliveries to all your customers yet burn the least about of fuel.
A correlation is used to determine whether an output value is related to an input value. You say that two data sets are “perfectly correlated” when their correlation value is 1. For example, if you think that sales = 2 * (number of sales people) and put those numbers into Excel, then you would have perfect correlation if you had (1,2), (2,4), (3,6) or (x,2x).
Here are the steps needed to turn on the Excel Analysis ToolPak add-in and solve a simple moving average problem.
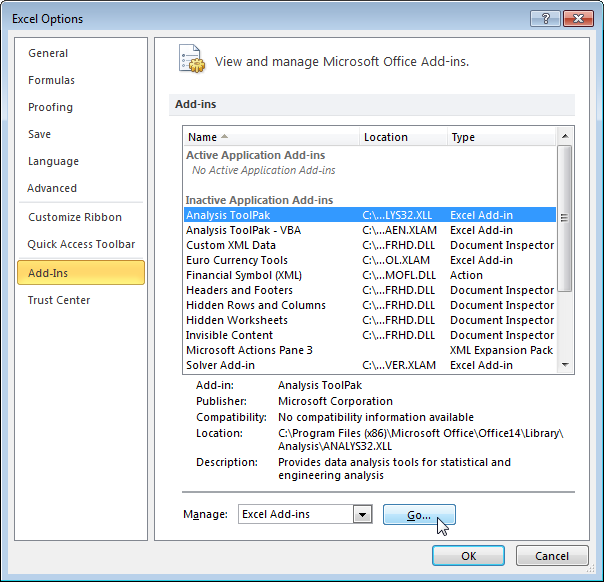
1.First, you have to the enable the add-in by going to File>Options>Add-Ins and selecting the Analysis Toolpak option. Then click the Go button
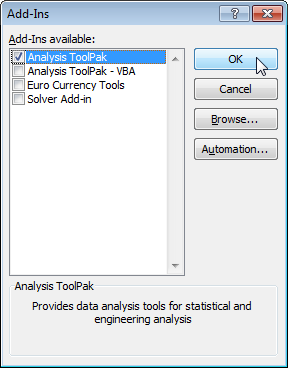
2.Check the box next to Analysis ToolPak. Press OK.
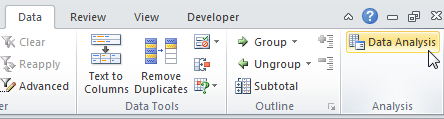
3.Now, on the Data menu, you have the Data Analysis option.
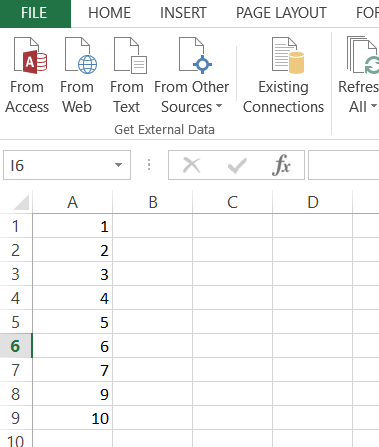
4.To try it out, make a spreadsheet, and put the numbers 1 to 10 in column a like this:
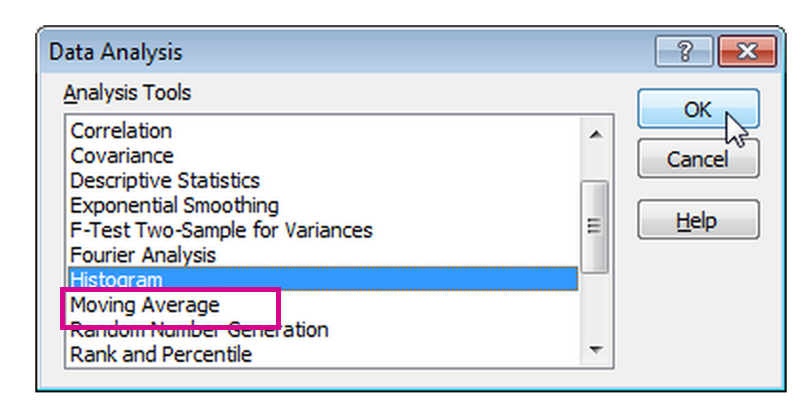
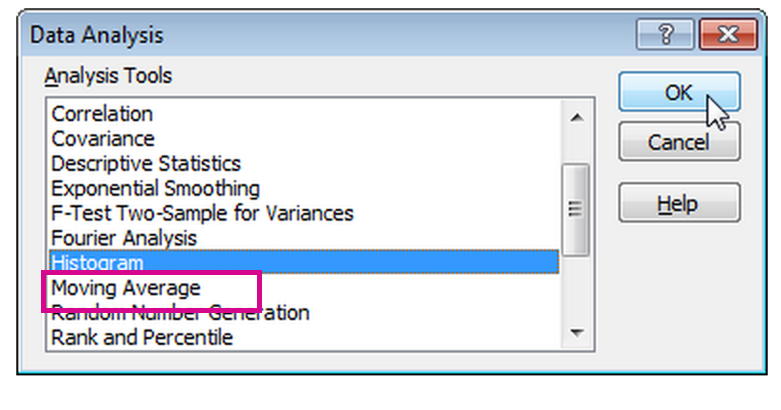
5.Then click the Data Analysis button and select Moving Average.
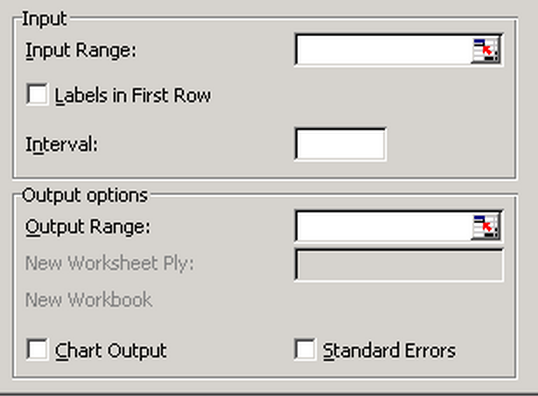
7.In the input range, select the range A1:A10. In the output range, select the Output Range B1:B10. If you leave the interval empty, it will default to 3. That means you have a 3 point moving average, which means take the average over the previous 3 data points to predict the current value.
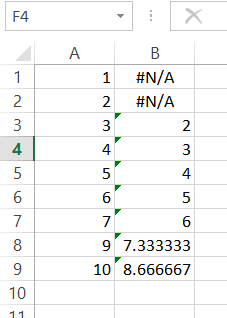
9.The value in cell B3 is 2, because the formula for a moving average is just like a regular average:
sum of data points / number of data points.
Therefore, in this case, the value is as follows:
(1+2 + 3) / 3 = 2